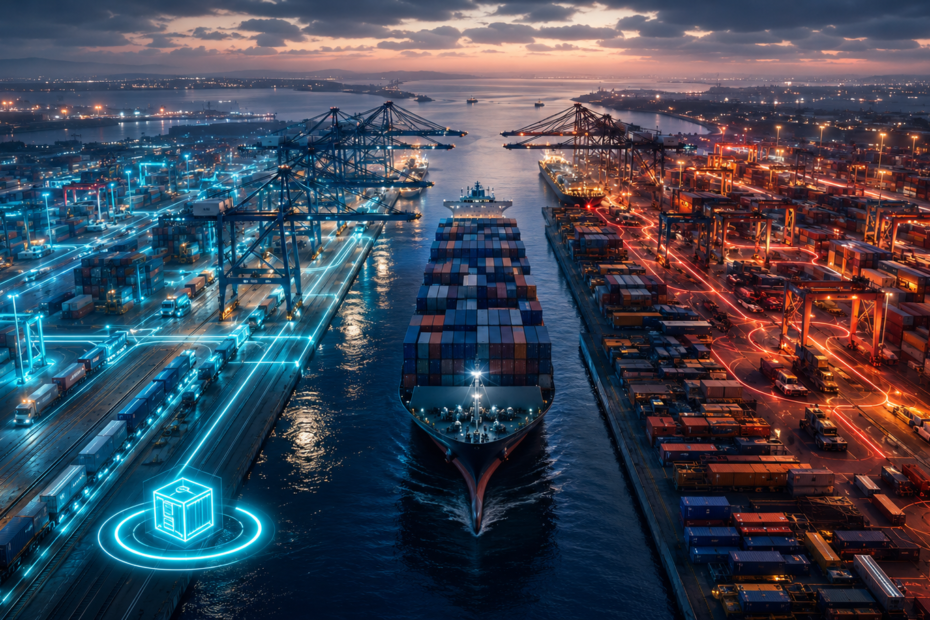
Why nominal port capacity and real cargo release are not the same thing
A vessel reaches the harbor on schedule. The berth is available. The cranes begin working. The container is discharged.
From a conventional shipping perspective, the port has done its job.
From an inventory perspective, the most important work may still be unfinished.
The container can remain inside the node waiting for a yard move, an appointment, a chassis, a rail-loading window, a document release, an available gate or a coordinated handoff.
None of these frictions requires the port to be closed. The vessel may depart while the inventory is still economically unavailable.
This is the starting point of Port Asymmetry:
Ports and terminals that appear equivalent by location, scale or nominal capacity can convert the same maritime arrival into materially different cargo-release patterns.
The asymmetry is not simply that one port is larger, newer or cheaper. It is that every port node has a different ability to absorb concentrated arrival pulses and release cargo into the inland network with stability.
The Market Measures the Entrance More Easily Than the Exit
Port conversations are dominated by visible inputs: annual TEU capacity, channel depth, number of berths, crane count and vessel size.
These indicators matter, but they describe what a port can receive more clearly than what it can release.
A port is not a single machine. It is a coordinated system of quay, cranes, yard, equipment, gates, rail, labor, information and commercial rules.
Increasing the capacity of one element does not guarantee that the complete system will move more cargo.
If the quay discharges containers faster than the yard and inland interfaces can evacuate them, the achievement at the vessel creates pressure elsewhere.
Containers accumulate. Yard density rises. Additional moves may be required. Appointment windows become harder to use. Rail-destined containers wait for the next synchronized departure.
The bottleneck has not disappeared.
It has moved.
The Useful Unit of Analysis Is Smaller Than a Port
This is why the useful unit of analysis is not simply “Port of X.”
It is:
Terminal × Service × Inland Mode × Cargo × Period
A refrigerated container, a dry container moving by truck and a dry container moving by on-dock rail do not experience the same operational node—even when they are discharged inside the same port complex.
A Real Example: One Port Complex, Two Release Patterns
The San Pedro Bay port complex is located on the Pacific coast of Southern California, in the United States. It comprises the neighboring ports of Los Angeles and Long Beach: two separate port authorities operating within the same maritime gateway. This makes the area especially useful for demonstrating Port Asymmetry. Vessels enter the same bay and similar cargo moves through one geographic complex, yet inventory-release outcomes can differ according to the terminal and the inland transport mode.
The Port of Los Angeles alone lists seven major container terminals and six intermodal rail yards with direct access to the Alameda Corridor.
That infrastructure may look like one integrated gateway on a map, but cargo does not leave it through one uniform process.
Pacific Merchant Shipping Association reports show a recurring difference between locally trucked imports and rail-destined imports:
- In October 2024, truck-destined cargo averaged 3.16 days at terminals, while rail-destined cargo averaged 9.86 days.
- In February 2025, the figures were 2.81 days by truck and 8.00 days by rail.
- In June 2026, the gap had narrowed, but it had not disappeared: 2.89 days by truck versus 5.43 days by rail.
What the Data Proves—and What It Does Not
These are aggregate figures for the port complex, not terminal rankings.
They do not prove that a specific terminal is inefficient, and they do not isolate a single cause.
Rail equipment, train assembly, carrier allocations, cargo surges and terminal operations can all influence the result.
What the figures demonstrate is more fundamental:
The same gateway can produce different inventory-release outcomes depending on the interface through which the cargo must leave.
The February 2025 report also corrected the prior month’s rail figure to 7.08 days.
That detail matters.
Port analysis cannot be built from screenshots, remembered averages or an attractive dashboard alone. Definitions, corrections and observation periods can change the conclusion.
Why Port Performance Is Not One Number
The World Bank and S&P Global’s Container Port Performance Index provides a global benchmark based on vessel time in port.
Its methodology controls for vessel size and call size, uses verified port-call records and is valuable for identifying performance gaps.
However, the methodology contains an important warning for anyone searching for Port Asymmetry.
The CPPI measures performance at the port level, not at the level of individual terminals.
It measures vessel time, not the complete interval until an importer can use the inventory.
The methodological note also states that the index identifies performance gaps but does not, by itself, explain their causes.
This is not a weakness in the index. It is a boundary around the question it answers.
Vessel time can reveal how efficiently a port receives and works a ship.
Container dwell can reveal how long cargo waits after discharge.
Truck turn time can reveal how a gate transaction performs.
Appointment fulfillment can reveal whether planned access becomes actual access.
Rail dwell can reveal the quality of the intermodal handoff.
Each metric observes a different interface.
The analytical error is treating one of them as a complete verdict.
Even the West Coast Marine Terminal Operators Agreement notes that truck turn times vary with terminal size, gate count, automation, chassis waiting time, inspections and other operational factors.
Two terminals inside the same port complex therefore cannot be assumed to have the same operating capability merely because they share the same harbor.
The Hidden Mechanism: Unevenness Multiplies Inside the Node
Ships do not arrive as a perfectly level stream of containers.
They arrive in batches.
A single vessel call can discharge thousands of units into a system whose gates, rail departures, equipment and labor shifts operate through different calendars and capacities.
When the inflow pulse is larger than the node’s effective release capacity, the imbalance becomes inventory inside the terminal.
This is the structural mechanism:
- Arrival concentration places cargo into the node in large pulses.
- Unequal internal capacities move that cargo through quay, yard and equipment at different speeds.
- Scheduled release windows limit when trucks, trains and other modes can receive it.
- Coordination gaps prevent physical capacity from becoming usable capacity.
- Commercial clocks convert time inside the node into storage, demurrage or service exposure.
The port may have enough annual capacity and still struggle during the exact hours or days that matter to a shipment.
Nominal capacity is a stock description.
Effective capacity is a flow result.
Heijunka: The Japanese Principle That Explains the Difference
The most natural Japanese lens for Port Asymmetry is Heijunka, or production leveling.
Toyota describes Heijunka as production smoothing or leveling: maintaining average production volumes and sequencing work so that variability does not overwhelm one department, process or supplier.
Its function inside the Toyota Production System is practical.
Instead of sending one large batch of similar work through the production line and creating uneven demand downstream, the system levels volume and mix over time.
Heijunka is not a Zen doctrine, and it is not a decorative metaphor.
It is an operating response to Mura, or unevenness.
The Connection with Port Operations
A port receives cargo through concentrated maritime arrivals.
The quay, yard, gates, rail connections, transport providers and information systems must then absorb and distribute that volume.
A terminal may unload a vessel quickly while transferring the imbalance to the yard.
The yard may process the containers while the gate lacks appointments.
The gate may have capacity while chassis are unavailable.
The rail terminal may have physical infrastructure while the required train departure is delayed.
Maximum performance at one interface does not guarantee balanced flow through the complete node.
Heijunka changes the question.
Instead of asking only:
How fast can the terminal unload the vessel?
Port Asymmetry asks:
How effectively can the node transform a concentrated and variable arrival into a stable, usable release of inventory?
Under this lens, a terminal with impressive cranes but unstable gates may be less effective for truck-dependent cargo.
A terminal with on-dock rail but irregular train loading may be less effective for an intermodal inventory program.
A digital platform may improve visibility without creating the physical capacity required to execute the plan.
The objective is not maximum speed at one workstation.
It is balanced flow across the interfaces that must work together.
The Limit of the Heijunka Connection
A port cannot transform vessel arrivals into a perfectly smooth production schedule.
Weather, tides, shipping networks, labor constraints and commercial priorities impose real limits.
An importer does not control the terminal’s berth plan, crane allocation or labor schedule.
The connection with Heijunka is therefore diagnostic, not literal.
KYOTEN does not claim that an importer can level global maritime traffic.
The principle helps evaluate whether the selected port node can absorb an arrival pulse without transferring excessive instability to the inventory system.
What Port Asymmetry Is—and Is Not
Port Asymmetry must remain separate from two other KYOTEN themes.
Route Asymmetry compares the complete path until inventory is economically available. It asks whether the apparently cheapest port creates a more expensive total route.
Port Asymmetry isolates the operational node. It asks how the terminal-service-mode configuration receives, processes and releases cargo before the inland journey resumes.
Customs Asymmetry examines legal treatment, valuation, classification, documentation and release by government authorities.
Customs delays can affect port dwell, but they are not automatically port-performance failures.
In a rigorous comparison, customs holds must be separated as an external or control variable.
This boundary matters.
If ocean freight, inland mileage and duties are mixed into one score, the port disappears inside a route calculation.
If every delay is blamed on the terminal, customs, carrier-controlled and shipper-controlled causes disappear.
Port Asymmetry is not a general route comparison.
It is not a ranking based on port reputation.
It is not a simple comparison of terminal tariffs.
It is not proof that a larger or more automated port is always better.
It is the study of how a specific port node converts maritime arrival into available inventory.
The Economic Consequence Is Variability, Not Only Delay
Markets often focus on average dwell.
Inventory systems experience the complete distribution.
A port node that usually releases cargo in three days but frequently takes eight may be more damaging than a node that consistently releases cargo in four days.
The first node can require larger safety stock, wider delivery promises and more working-capital protection.
The second may appear slower when judged only by its average, but it may be easier to plan and operate.
This is why reliability can become an economic capability.
The consequences appear beyond the terminal invoice:
- Inventory remains unavailable for sale or production.
- Purchase orders require larger time buffers.
- Stockout risk increases.
- Working capital remains tied up.
- Downstream warehouses and transport appointments lose synchronization.
- Exceptional interventions replace repeatable operating routines.
- Commercial penalties can begin before the inventory becomes usable.
None of these outcomes proves that a different port is automatically better.
The alternative must still be compatible with the cargo, ocean service, inland mode, equipment requirements and commercial commitments.
Port Asymmetry is not a promise of arbitrage.
It is a warning against false equivalence.
The KYOTEN Principle
The port’s real product is not the vessel call.
It is the controlled conversion of maritime arrival into available inventory.
A serious port decision therefore cannot stop at annual capacity, a published average or a tariff headline.
It must ask whether the node can absorb the shipment’s arrival pattern, coordinate the required interfaces and release the cargo with enough stability for the inventory model that depends on it.
The ship’s arrival is an event.
Stable cargo release is the operational result.
Sources
World Bank — Container Port Performance Index 2025
World Bank — CPPI Methodology Note, June 10, 2026
Port of Los Angeles — Container Facilities
Port of Los Angeles — Cargo Operations Dashboard
Pacific Merchant Shipping Association — San Pedro Bay Dwell Time Archive
PMSA — October 2024 Dwell Times
PMSA — February 2025 Dwell Times
West Coast Marine Terminal Operators Agreement — Truck Turn Times